
Finding the connection
A Western Australian farm family is using precision tools to understand how to manage different soils and how it determines outcomes on their Woodanilling farm.
Kerry Crosby, his father Roger and brother Braden have planted 3300 hectares of wheat, barley, canola, oats and lupin. They also run a 4000 commercial flock of self-replacing merino ewes, across 700 hectares. Kerry and Braden are the fifth generation on the farm, with the family celebrating a century on the land this year.
The region averages between 400mm to 450mm rainfall per year, although the averages have been lower over the last number of years.
The farm has a range of soil types that the family have to contend with, from heavy loam to sandy duplexes and gravel ridges.
Because of the different soil types and the effect it has on nutrient uptake and yield, the family have been exploring variable rate application and other precision methods for four years.
Kerry says two main challenges are figuring where the point is where the nitrogen response flattens out, and how the curve of diminishing returns works.Tied to that is having enough data to make variable rate applications a lot more accurate.
To this end they soil test all paddocks every three to four years, analysing PK and nitrogen, amongst other things.
Kerry says although paddock testing gives accurate results, it cannot fully reflect what nutrients are plant-available. He uses a range of tools to help him.
One such tool is Normalized Difference Vegetation Index (NDVI) maps. NDVI is a calculation that uses satellite data to determine the health and density of vegetation.
He wants to use it to map soil type and crop performance, and draw better conclusions around interactions between soil, nutrient availability and yield.
The Crosby’s also focus on soil pH, with Kerry saying they try to keep soil pH above 5 to 5.5. They do this by soil testing and liming when required, applying roughly 2T/ha every 3-5 years, depending on soil test results.
He uses CSBP Decipher Ag’s platform to help manage soil and plant sampling, which records sampling information in one location, so it’s easy to manage.
With it he can map the farm and paddocks, view sample site locations, plan and store sample information such as test selections and sample depth and view daily, monthly and seasonal biomass imagery.
Using CSBP he particularly tries to understand Phosphorus (P) and Potassium (K) in soils. K is particularly valuable on the farm as heavy red soils are very high in K, and lighter sandy soil types that are typically low in K.
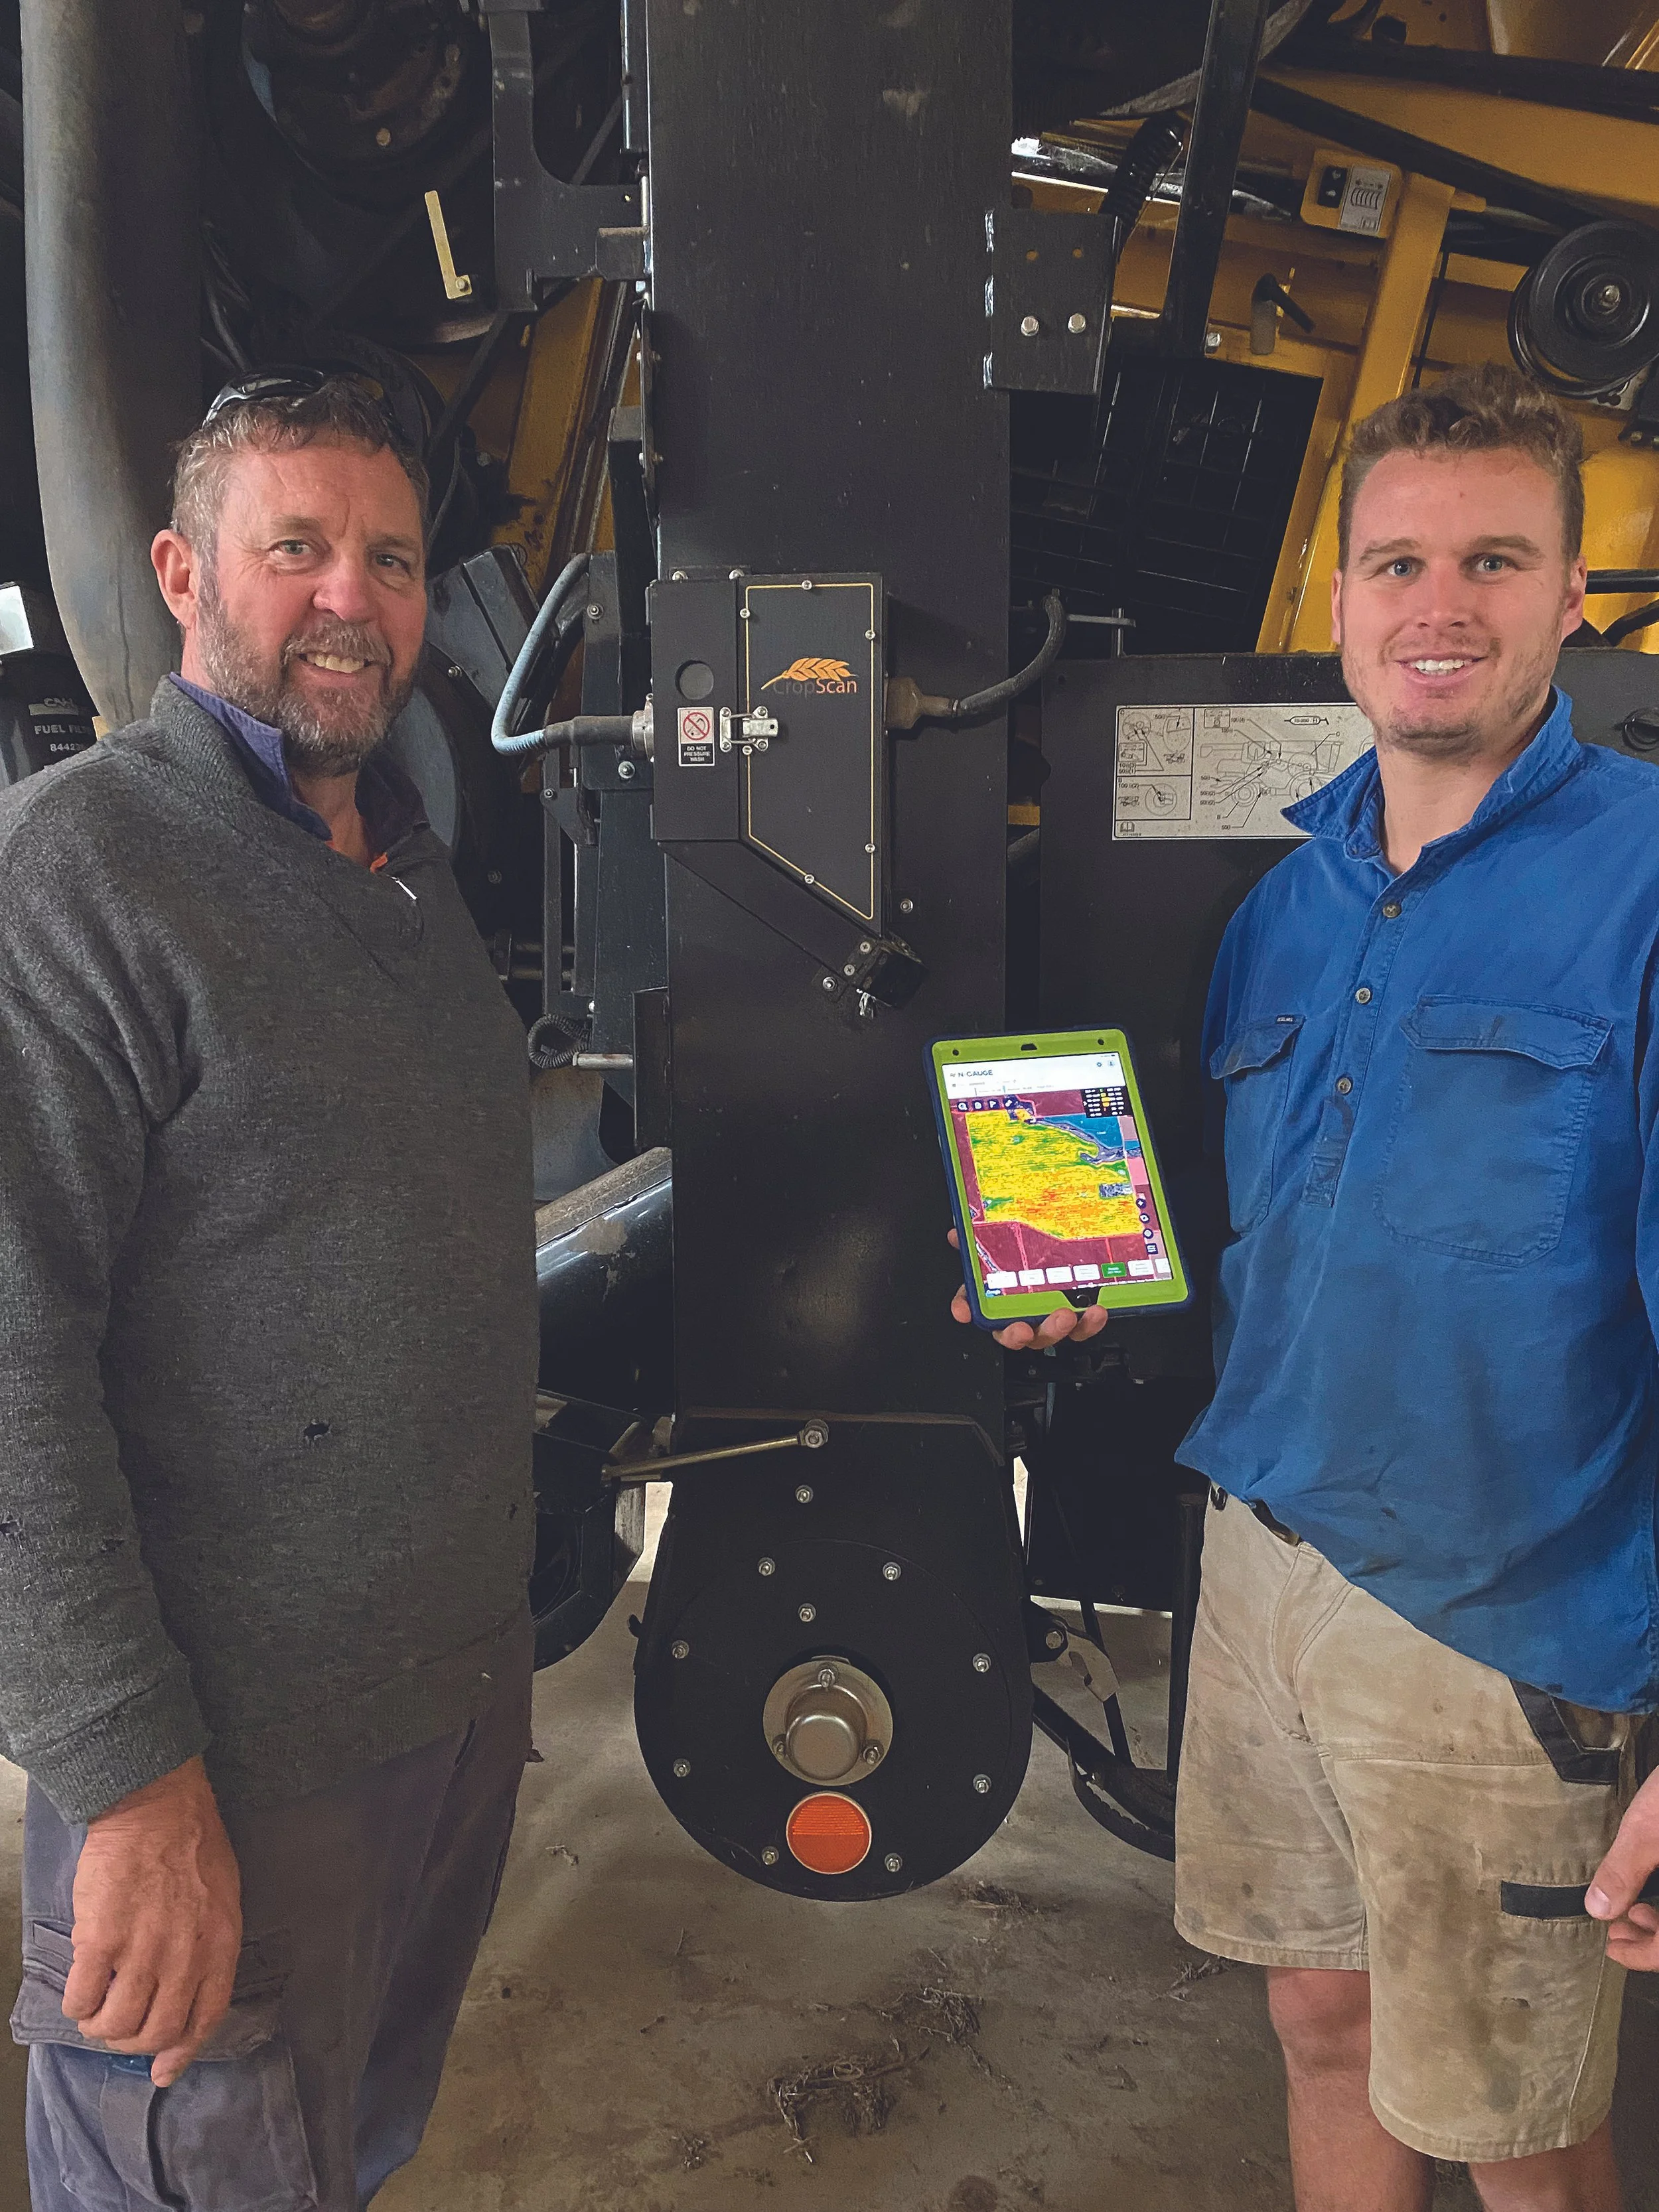
Kerry was one of 10 to test the CropScan 4000VT Grain Analyser released in 2023. It is now a key precision tool he relies on.
Kerry operates a New Holland 9.90 Combine, with the 4000VT fully integrated. CropScanAg says the tech includes near infrared transmission tech; the world standard for measuring whole grains and oil seeds.
It also includes REAL-TIME protein, moisture, oil, fibre and starch data, across major crop types, with data synching directly to the N-GAUGE app and server.
It features new sample head design; increased 3-4 second scan speed for high density field maps and higher spatial density data maps, with 180 readings per hectare.
Calibrations include wheat, barley, canola, lentils, chickpeas, lupins, rice, oats, corn and soybeans, with a large sample head to ensure flow.
Kerry says the protein meter shows him that, just because a soil test shows nutrients are present, it doesn’t mean they’re all plant-available.
Kerry says they always keep production targets front-of-mind and, for example, for canola, typically aim to harvest 2.5 to 3 tonnes per hectare, with the goal of pushing beyond 4 tonnes per hectare in cereals.
“The higher you push yields, the more the soil variance comes into play,” he says. “I honestly do believe protein content is going to be the next big focus.”
“We’ve been using this tech for three years, doing two harvests with it, and we’ve seen the potential when it’s working well.”
The system measures protein, oil, moisture, starch, and fibre in real time.
“From a grain logistics perspective, it’s a game-changer. You can see tank averages as you're loading trucks, and manage grain movements straight from the iPad — which bin it’s in, what the protein and moisture levels are, all on the go.”
But for him, the real promise lies in how it links to nitrogen use.
“Being able to overlay protein mapping with soil types or zones in your paddocks, and then build variable-rate nitrogen maps off that — it’s incredible technology. I can’t wait until we’re able to unlock its full potential.”
The N-Gauge app, developed by Matt Clancy from Next Instruments, will be key to precision growing in the future, he says.
“That’s become a key part of how we use the protein meter.”
While the protein meter itself captures raw data, it’s the app that makes it practical.
“N-GAUGE takes that data and turns it into maps. We can correlate protein and yield data with other layers — anything from soil types to nitrogen removal.”
A key focus is understanding nitrogen use and removal, and how that affects overall plant performance.
“There’s a huge connection between nitrogen, yield and protein. It’s something we’ve known for a long time — if you’re consistently harvesting lower-protein grain, it’s usually a sign that you can have a lot of potential upside in applying more Nitrogen.”
That can have an impact on both yield and finances.
“If your protein’s down, you’re potentially losing out — both in grain weight and value. When protein levels increase, you’re improving both yield and quality, and that shows up in the returns.”
“We’re definitely seeing that each soil type has a different efficiency when it comes to converting nitrogen into a usable form,” he says.
“In some parts of a paddock, we’re applying around 60 units of nitrogen and pulling over six tonnes of barley, with protein levels above 9.5%.”
But it’s not consistent across the whole field.
“In the same paddock, there are areas where we’re putting on 100 units and only getting two to three tonnes — even though protein is still over 9.5%. So there’s a massive difference.”
The variability highlights how important it is to understand the relationship between soil type, nitrogen efficiency and return on investment.
“Each soil type has its own response curve — its own point of diminishing returns. That’s where the data really helps us make more informed decisions.”
“It’s changing the way we manage those poorer-performing zones,” he says.
“For example, if we’ve trialled 70 units of nitrogen one year, then bumped it to 90 the next and still seen no difference in yield or protein — we understand that, that soil type has reached its capacity.”
“There’s no point pushing more nitrogen into a block that’s not responding, so with the use of N-gauge we can better understand each soil type's response curve.”
As soon as they start varying rates within a paddock, it’s no longer managed as one block.
“The moment you vary the rate, you’ve effectively created two different paddocks. And you’re going to treat them differently from then on. With the use of N-Guage it is very simple to manage each zone”
That kind of approach requires a long view.
“It’s not just about this season. It’s about understanding how we’ll manage that land over a three-, five-, or even ten-year period. The big question is whether, with enough data and refinement, will we ever get back to a blanket rate — or if this variability is here to stay.”
At this stage Kerry says he is seeing gains by following the variable rate approach.
Kerry says we have known for years that nitrogen leaches — that it needs to be reapplied annually as standard practice.
Different soil types are clearly holding onto nitrogen in different ways. That’s shifting how they view nitrogen losses.
Leaching remains on the radar, but it may not be as widespread or severe as once believed. The evidence suggests a more complex picture than traditional blanket assumptions allowed.
While they figure this out Kerry says they are not doing variable applications across the whole farm yet.
“There's still a little bit we want to learn about how it all sort of fits in all together.”
However in areas where they focus on precision yield has gone up.
“After year one you might have a 20% to 30% Nitrogen application variance between your highest and lowest plots. By year five it might be back to a 5% or 10% difference, but with what we have found to far each soil type is different.”
Kerry says he has been playing around with N-GAUGE to map soil types dependent on crop performance.
“It uses yield and protein data to show patterns — like where you’re getting high yield and high protein, or low protein and low yield. It’s helping us understand where different soils are performing well or falling short.”
“You want to put fertiliser where you’ll get the best return,” he says. “Soil tests help, but applying nutrients based on crop response is more complex — that’s where N-GAUGE makes it simple.”
“The protein meter is only half the tool — the app is the other half.”
The Crosbys run a New Holland 9.90, with a Can Bus protein meter.
With growing becoming more expensive, Kerry says they want to be as efficient as possible, with these tools making it easier to find efficiencies.
Kerry says the industry has many challenges, climate, as always, is a challenge for the region.
Then there is outside influence, with for example, Sheep live export ban, a key to their sheep operation, on the chopping block.
“Which was 100% a political agenda with zero understanding for the wider global agricultural industry,” he says.
“It’s scary how our industry has been negatively affected by people playing politics in Canberra”.
There are also useful ag chemicals that are also on the chopping block. But it doesn't help being deterred.
Kerry says we're not far from tractors driving themselves and fertiliser inputs being precisely calculated, with many in the industry working toward a more efficient future.
On their farm they try and find efficiencies, and keep going forward.